
Search Console: how to read clicks, impressions, CTR and position

Learn to read the Search Console Performance report: what clicks, impressions, CTR and position measure, and how to compare dates without drawing false conclusions.
You open Search Console on a Monday and see that clicks went down, but impressions went up. Are you doing well or badly? Without knowing what each column measures, it's easy to celebrate what doesn't matter or get scared over nothing.
The Performance report tells you how many times you appeared on Google and how many people came in from there, and with that you can decide what to improve.
What do clicks, impressions, CTR and position measure?
Each metric answers a different question about your presence on Google. According to the official Search Console help, clicks are the times someone entered your site from the results, and impressions are the times your site appeared in them. CTR is the click count divided by the impression count, and average position tells you where you usually appear.
| Metric | What it answers | How to read it |
|---|---|---|
| Clicks | How many people came in? | More is better, if they are visits you care about |
| Impressions | How much do people see me? | Reach, not visits |
| CTR | Do they pick me when they see me? | Clicks divided by impressions |
| Position | Where do I appear? | A lower number means higher up |
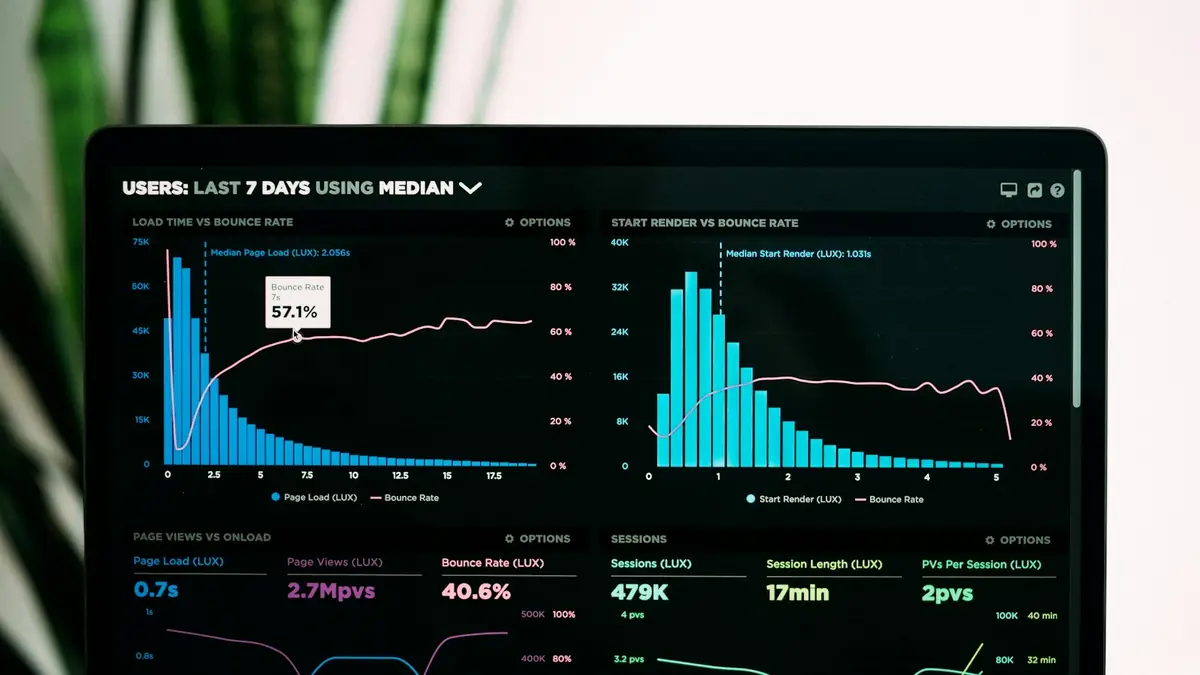
Why isn't the chart position the same as the table position?
Because the chart is calculated for the whole site and the table for each row. Google explains that in the chart the average position corresponds to the highest result of your site, while in the table it is the average position of the URL or dimension that groups each row. The help also clarifies that the chart aggregates by property: if two of your pages show up in the same search, it counts as a single impression.
So don't be alarmed if a number in the chart doesn't exactly match the sum of the table. It's a difference in how it is aggregated, not an error.
How do I compare dates without fooling myself?
Use the Compare tab in the date filter and choose a weekly or monthly view. Google's guide on traffic drops suggests comparing the last 3 months with the previous period or with the same period of the previous year. According to the help on advanced filtering and comparison, when contrasting two ranges the weekly or monthly granularity is best to avoid the day-of-week effect. You can only have one active comparison at a time.
Common mistake: comparing a Monday against a Sunday, or a high-season month against a low-season one. The chart drops, but your site did nothing wrong. Always compare equivalent periods.
How much data does it keep, and what happens with the most recent data?
Search Console shows you 16 months of history, and data from the last few hours can change. Google recommends choosing "Last 16 months" to see whether a drop repeats every year because of a season, and to keep more history it suggests the Search Analytics API or bulk data exports. In addition, the report help says the most recent data may be preliminary and is shown with a dotted line, because it could change in the next few hours.

What do I do with these numbers in my business?
Start with the pages and queries where you have many impressions and few clicks. There Google already shows you, but people don't pick you, and it is usually a matter of improving the title and description: we have a guide on titles and meta descriptions that Google does show. If a page has almost no impressions, check whether it is indexed with the guide on pages not indexed in Search Console.
To know whether it was your site or Google that changed, mark your changes with annotations in Search Console and cross what you see with the November 2026 core update. And if you already get visits, measure what they do next with the key GA4 events.
In short
That Monday with fewer clicks and more impressions is no longer a mystery: it means you appear more, but people choose you less, and CTR tells you where to look. Compare equivalent periods, use the weekly or monthly view and take advantage of the 16 months of history. If you want us to measure it and turn it into a plan, check out our SEO and GEO service.
Frequently asked questions
What is CTR in Search Console?
According to Google, it is the click-through rate: the number of clicks divided by the number of impressions.
How many months of data does Search Console keep?
Google states in its guide on traffic drops that the report shows 16 months. To keep more history you can use the Search Analytics API or bulk data exports.
Why doesn't the chart position match the table position?
Because they measure different things: in the chart it is the average position of the highest result for the whole site, and in the table it is the average position of the URL or dimension in each row.
How do I compare this month with the same month last year?
In the date filter, go to the Compare tab. Google offers comparing with the previous period or with the same period of the previous year, and for your own ranges you can create a custom comparison.
Can I have several comparisons at once?
No. According to Google's help, you can only have one active comparison, and if you add another it replaces the previous one.
Do not stop at the theory: apply it to your business
We implement SEO and GEO with AI end to end, with your real operation. The first conversation is free.